Plotr是一个基于PlotKit与MochiKit的轻量级Javascript制图库。Plotr依赖于prototype以及HTML Canvas。
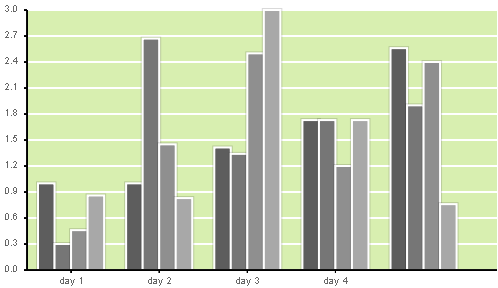
Plotr 的使用相当简单,下面是Plotr的官方示例:
<div><canvas id="bars1" height="300" width="500"></canvas></div>
 <script type="text/javascript">
 // Define a dataset.
 var dataset = {
     'myFirstDataset': [[0, 1], [1, 1], [2, 1.414], [3, 1.73], [4, 2.56]],
     'mySecondDataset': [[0, 0.3], [1, 2.67], [2, 1.34], [3, 1.73], [4, 1.9]],
     'myThirdDataset': [[0, 0.46], [1, 1.45], [2, 2.5], [3, 1.2], [4, 2.4]],
     'myFourthDataset': [[0, .86], [1, 0.83], [2, 3], [3, 1.73], [4, 0.76]],
 };
 // Define options.
 var options = {
     // Define a padding for the canvas node
     padding: {left: 30, right: 0, top: 10, bottom: 30},
     // Background color to render.
     backgroundColor: '#d8efb0',
     // Use the predefined blue colorscheme.
     colorScheme: 'grey',
     // Render a horizontal oriented barchart.
     barOrientation: 'vertical',
     // Set the labels.
     xTicks: [
         {v:0, label:'day 1'},
         {v:1, label:'day 2'},
         {v:2, label:'day 3'},
         {v:3, label:'day 4'}
     ]
 };
 // Instantiate a new BarCart.
 var vertical = new Plotr.BarChart('bars1',options);
 // Add a dataset to it.
 vertical.addDataset(dataset);
 // Render it.
 vertical.render();
 </script>
效果如下:


评论